
Businesses across the whole world are struggling to respond to the new coronavirus impact. Leaders must take rapid decisions about controlling costs and maintaining liquidity. They need to define the right priorities while staying agile and adjusting their decisions quickly to ongoing changes.
How to get prepared in the time of uncertainty? How to build both short-term and long-term strategies? And how to improve the well-being of your business?
In this post, we are going to answer these and many other questions. As a data-driven company that has helped enterprises and Fortune 500 companies to launch and scale their Data Analytics directions, we’ll dive deeper into how data and analytics can be used effectively in terms of supply chain issues, crisis management solutions, cost optimization, operation optimization. And how it can be leveraged effectively to model and generate different recovery scenarios.
First of all, let’s take a look at how entities across the whole world use Data analytics and AI to curb the epidemic.
How Data Analytics and AI are used to halt the COVID-19 pandemic
Policy-makers, government organizations and other entities across the globe have used AI platforms, Big Data analytics, data visualization tools to predict where the virus will go next, track the virus spread real-time, identify medications that may be helpful against COVID-19, and much more.
People who work at the epidemic outbreak locations collect vital data on COVID-19, such as transmissibility, risk factors, incubation period, and mortality rate. This data is used for visualizations, creating mathematical models, and training neural networks.
Different sources of information are used. For instance, David Heymann, Executive Director of the Communicable Diseases Cluster, WHO, says: “By monitoring social media, newsfeeds, or airline ticketing systems, for example, we can tell if there's something wrong that requires further exploration. All these things together are very important.”
Here are just a few cases of how Data Analytics and AI are used to try to curb the epidemic:
-
The Canadian company, Blue Dot used AI and was widely reported as the first company to reveal news of the outbreak in late December.
-
On January 22, 2020, Johns Hopkins University first shared an interactive dashboard that is used for tracking real-time data on coronavirus cases, deaths, and recoveries.
-
Insilico Medicine, a Hong Kong-based company, announced that its AI models had designed six new molecules that could stop the virus from replication.
-
Medical Home Network (MHN), a Chicago-based nonprofit organization, has implemented an AI platform to spot Medicaid patients most at risk from COVID-19.
-
On March 5, 2020, Google’s DeepMind published research discussing how they used deep learning to predict the structure of proteins associated with SARS-CoV-2, the virus that causes COVID-19.
-
COVID-Net, an AI-based solution, was built to diagnose COVID-19 using chest x-rays of patients with different lung conditions, including COVID-19.
-
An AI-based computer vision camera system scanning public areas has been used to monitor whether people in the UK city of Oxford keep to the social distancing measures of the government.
-
IBM has aggregated COVID-19 data and integrated it with The Weather Channel app, which will meld weather data and local novel coronavirus incidents. Via its The Weather Channel App, IBM's subsidiary can get relevant COVID-19 data to its 300 million active monthly users.
-
Esri is applying its mapping and geolocation expertise to COVID-19 tracking. Esri has also localized COVID-19 case data and combined it with bed availability data from Definitive Healthcare. The dashboard, which uses Esri's ArcGIS Business Analyst software, gives a snapshot of preparedness at the county level.
As we can see, different entities leverage Data Analytics and AI to try to halt the epidemic. And there are many tools and open data sources that provide updated information.
What regards the most effective methods, most models used for tracking and forecasting the epidemic do not use AI. Instead, most scientists prefer established epidemiological models, so-called SIR models, which track the numbers of susceptible, infected and recovered people with the help of ordinary differential equations (ODE).
What concerns using AI to predict and diagnose COVID-19, it has not yet been very helpful against COVID-19 as its efficiency is blocked due to lack of historical training data. And we are more likely to see it used for social control and other tasks by leveraging computer vision, image recognition, and robots (e,g for disinfecting hospitals).
Now let’s take a look at how your business can use Data Analytics to get prepared, react effectively, and develop both short-term and long-term strategies.
How Data Analytics is used by businesses to operate in the time of COVID-19
Data analytics is widely applied to tackle business challenges created by the epidemic. According to a recent survey of 300 analytics professionals across the US conducted by Burtch Works and the International Institute for Analytics (IIA), 43 % of respondents stated that analytics is at the front of their activities helping their organizations make major decisions in response to the COVID-19 crisis.

Source: Burtch Works Survey
What's more, more than 26 % of the respondents said that they were dealing with a substantial number of requests related to COVID-19, and more than 10% were asked to focus exclusively on the analytics related to the impact of coronavirus.

Source: Burtch Works Survey
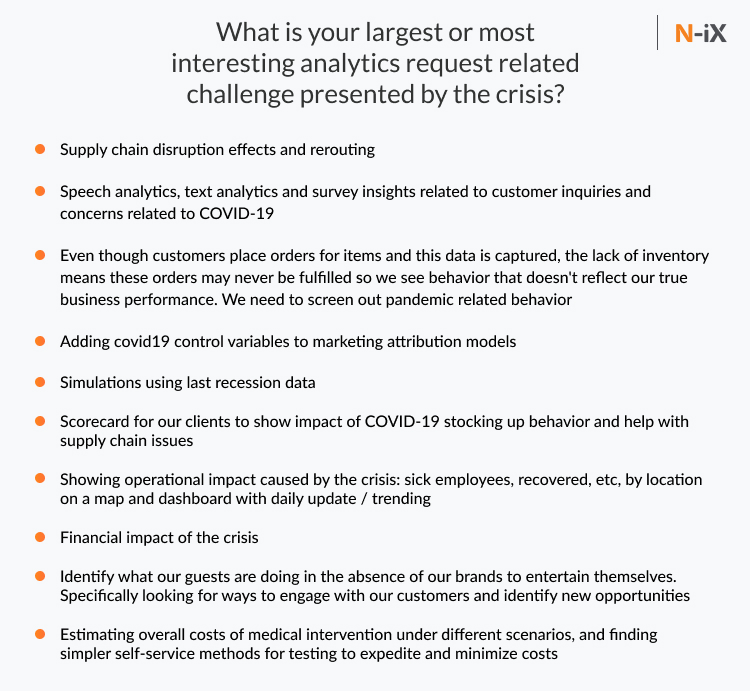
Data analytics is used to solve a variety of business challenges, which range from supply chain disruption effects to identifying financial impact of the crisis.
Source: Burtch Works Survey
Additional examples of how you can use Data Analytics to operate in the time of COVID-19
-
Communications providers depend on large call center operations to perform such vital functions as sales and customer service. The majority of retail locations are now closed, creating a huge pressure on call centers. To solve the problem and reduce call center volume, use analytics to identify customers most likely to be affected and develop proactive communication plans to keep them informed of policy changes and service disruptions. Also, consider using chatbots and automating your call centers.
-
In order to decrease customer churn rate, you can identify customers most likely to be affected by COVID-19 and determine how best to support them — for example, by providing flexible payment options or eliminating bandwidth caps (if you are a telecom).
-
Use analytics to reassess your supply chain to uncover weak links, especially in affected areas.
-
Telecoms can predict the periods of heaviest network usage arising from video streaming and alleviate congestion during these periods. Predictive analytics can help forecast traffic patterns and peak period routing and therefore helps to ensure the smooth running of network operations.
How your business can benefit from Data Analytics in the time of COVID-19
According to Gartner, here are the key ways you and your organization can benefit from Data Analytics in the time of the crisis:
-
Generate business and recovery scenarios based on forecasts and predictions of the crisis impact on operations, products, and services, supply and demand.
-
Early discovery of business trends, generating alerts and sharing vital information across the whole organization, including third parties and suppliers.
-
Identify alternative pathways for people, goods, and services.
-
Spot additional points of automation (e.g automating call centers).
-
Help with organizational daily planning.
What your business should do to take a data-driven approach to manage the COVID crisis:
-
Base your Business Continuity Management actions on Data Analytics. Use visualizations, dashboards, and notifications.
-
Enable assessment and measurement to be able to monitor the health of the business and your employees and address the issues promptly.
-
Identify business scenarios and the data needed to monitor and manage the impact of business ( areas of the supply chain, production, financial, HR, IT).
-
Combine internal organizational data and third-party resources.
-
Make the necessary info accessible and visible across the organization.
Keep tabs on the severity of the situation, how it impacts your region, your industry, your business operations, your suppliers, and your employees.
To do this effectively, you need to use your internal data in conjunction with 3-party sources: both global ones ( e.g., World Health Organization) and local public health entities.
There is a wide range of tracking and forecasting dashboards. MIT Technology Review has produced a ranking of these dashboards. Here are the best dashboards they recommend:
-
UpCode,
-
NextStrain,
-
the John’s Hopkins’ JHU CSSE,
-
Thebaselab,
-
the BBC,
-
the New York Times,
-
and HealthMap.

Source: NextStrain
Another notable dashboard is Microsoft Bing’s AI tracker. By ingesting and aggregating data from sources like the World Health Organization (WHO), the European Centre for Disease Prevention and Control (ECDC), and the US Centers for Disease Control and Prevention (CDC), the service helps us understand the volume of infected people on a national and global scale.
C3.ai has created a unified data lake of all publicly available COVID-19 data sets. The data set will be updated on May 15 with more data sets.
Other data sets that will be aggregated into the C3 data lake:
-
European Centre for Disease Prevention and Control: Worldwide Situation Updates
-
National Center for Biotechnology Information Virus Database
-
nCoV-2019 Data Working Group: Epidemiology Data
-
MOBS Lab: COVID-19 Situation Report
-
World Health Organization: Daily Situation Reports
-
New York ISO: Electricity Load Data
-
Indian Ministry of Health & Family Welfare: COVID-19 India
-
Sito del Dipartimento della Protezione Civile – Emergenza Coronavirus
-
Data Science for COVID-19 Indonesia Initiative
-
US Census Bureau: Population Data
-
IEEE: COVID-19 Tweets Dataset
-
Kaiser Family Foundation: Social Distancing Policies
Ensure the success of your Data Analytics processes
-
Develop core KPI’s to enable business impact tracking.
-
Check your organization’s data assets, need for additional acquisition, third-party data, data management to monitor the situation and make info accessible
-
Adress such leading challenges with analytics dashboards as poor data quality, interdepartmental collaboration, siloed tools/data, and alignment of data with business KPIs.
-
Assess the data quality and readiness for use in reporting, planning and making business decisions. Remember that 80% of all the Data Analytics processes are taken up by data processing and cleaning to make the data fit for a particular case.
-
Evaluate third-party services that can be used as external data sources.
-
Use Hadoop and Spark if you need to store and process Big Data.
-
For visualization, you can use such BI tools as Tableau, Power BI, Metatron, QlikView, and others.
We will be glad to answer any of your questions on how to implement or augment your Data Analytics processes.


