As the amount of data grows exponentially and more organizations rely on Big Data, it’s becoming more challenging to grasp meaningful insights from it. With the global data visualization market reaching $7.76B by 2023, the demand for such services is apparent. According to Deloitte, data visualization can benefit your organization, from unlocking key values and identifying patterns to making the data easier to understand.
In turn, data visualization consulting can be a valuable asset for companies looking to analyze and interpret their data effectively. In today's data-driven world, data visualization is essential for making informed decisions and presenting information clearly and effectively.
Whether you are a small startup looking to get started with data visualization or an enterprise looking to improve your existing visualization practices, hiring an enterprise data visualization consultant can be a valuable investment. In the following sections, we will delve deeper into the role of data visualization consulting experts and the various services they offer.
Why do companies need a data visualization consultant?
There could be dozens of reasons why companies consider data visualisation consultancy. The most common ones include:
Detection of patterns and anomalies: By visualizing data, companies can quickly and easily identify trends, patterns, and anomalies that may not be immediately apparent in raw data. It can be handy for identifying potential issues or opportunities that may require further investigation.
Tracking the overall business “health”: Data visualization can provide a comprehensive view of a company’s performance, allowing decision-makers to track key metrics and indicators over time. Consequently, this benefit can help identify areas of strength and weakness and inform strategies for improvement.
Getting the helicopter view of operational effectiveness: Effective IoT data visualization, for example, can help companies understand the big picture of their operations by highlighting areas of inefficiency or excess capacity that may not be immediately apparent in day-to-day operations.
Providing stakeholders with relevant, accessible, and up-to-date information: By presenting data visually, companies can make complex information more accessible and easier to understand for stakeholders such as employees, investors, and customers. It can help ensure everyone has the information they need to make informed decisions.

However, data visualization can also come with various challenges and limitations. These include:
- Data comprehension: One of the significant challenges of data visualization is accurately understanding the data and translating it into an easy-to-understand graphic representation. This challenge requires proficiency to ensure that the visualized information can be understood and lead to actionable insights.
- Data overload: When presenting large amounts of complex data, it can be difficult to visualize it effectively without losing meaning or context. It can lead to “data overload,” where visualizations become so complex that it’s hard to draw meaningful insights from them.
- Interpretation: One of the challenges of data visualization is accurately interpreting the information the visualization presents. It requires technical expertise and judgment to differentiate between valuable and irrelevant information.

By helping to identify patterns, track performance, and provide relevant information to stakeholders, data visualization specialists can help companies make data-driven decisions that drive growth and success.
Read more: How to choose the best Big Data developers
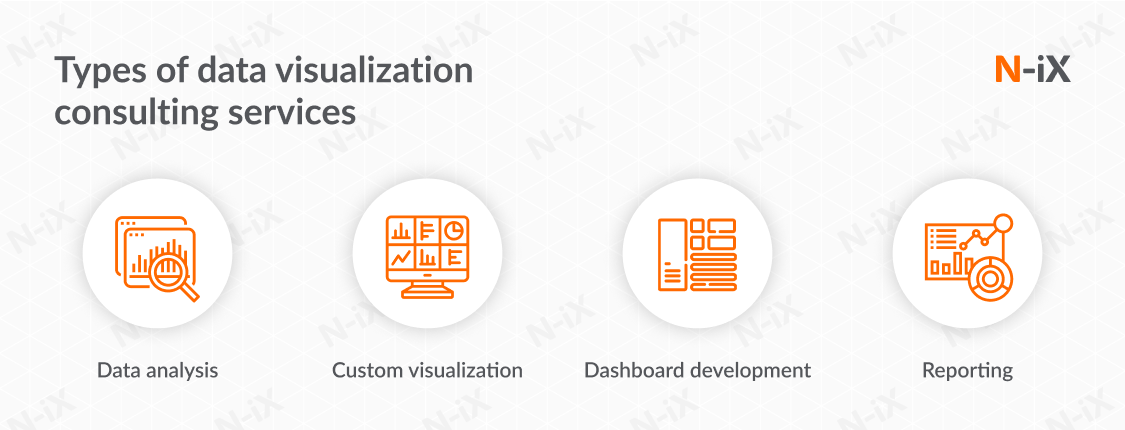
Types of services offered by data visualization consulting experts
It’s reasonable to know what data visualization services can be delivered before rushing to hire an expert. To help your operational efficiency and turn in the direction of making data-driven decisions, one or more of the following services could be of good use:
Data analysis: Analytics services involve understanding the quantity and quality of data to identify trends, identify correlations, and draw conclusions from the data. This consulting service is used to tailor-make data analysis solutions to gain insights into a company’s operations and performance. It is also beneficial for making sense of big data as it can determine what metrics are essential and what data should be collected to optimize organizational operations.
Custom visualization: Custom visualization services involve creating visual representations of data that meet the specific needs of an individual company or organization. This consulting service helps businesses communicate their data in a more impactful and precise way to make better decisions and report on their performance. It also allows organizations to identify patterns and gain insights into data that they were previously unaware of.
Dashboard development: Data visualization consulting specialists can help companies create interactive dashboards to monitor and track key metrics and performance indicators in real time. Dashboards are graphical representations of data that display essential information in an easy-to-understand format. They can track a wide range of data, such as sales figures, website traffic, and customer satisfaction. This consulting service can help organizations identify areas to improve performance or may need additional resources or investment.
Reporting: Reporting and presentations refer to developing custom-designed reports for internal or external stakeholders. This consulting service involves visual tools to present business information more engagingly and effectively. Reporting helps organizations communicate key findings that are relevant to their stakeholders in an efficient manner. If your organization struggles with identifying potential growth areas, revamped reporting can become a big improvement point.
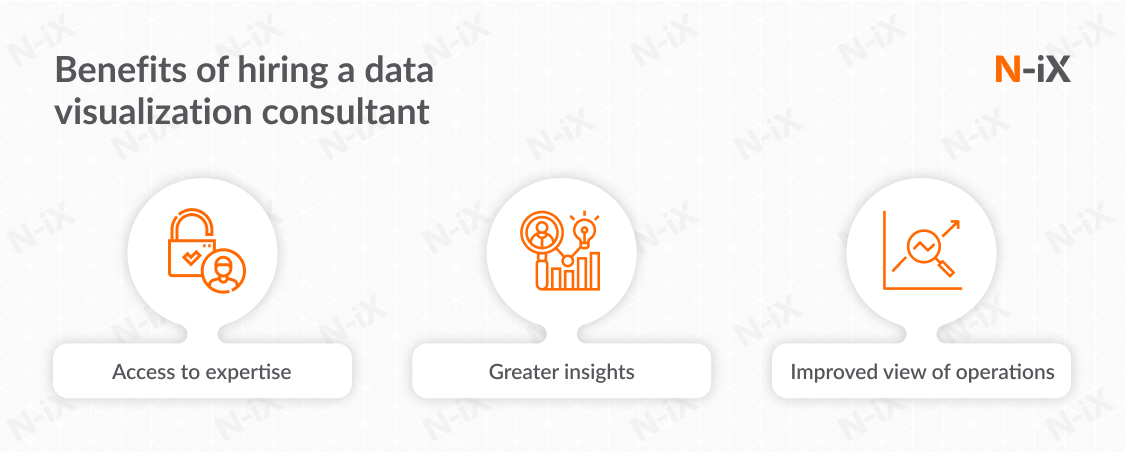
Benefits of hiring a data visualization consultant
According to Deloitte, data visualization brings dozens of benefits to organizations and can be utilized variously to understand your organizational situation better. With that in mind, it’s crucial to understand why you might need to hire a data visualization consultant for your organization. As a whole, some of the most convincing reasons to partner with a data visualization consulting company are:
Access to expertise. One of the main benefits of hiring a competent consultant is that they can bring a wealth of expertise and knowledge to the table. These specialists are trained in data visualization tools and techniques to extract insights from data and are skilled in presenting this information. This benefit can be precious for companies that do not have in-house data visualization expertise or need to supplement their existing team with relevant skills.
Greater insights: Experts from data visualization consulting companies can uncover patterns and trends in their data that they may not have been aware of, leading to new insights and opportunities. For example, a company may have a large dataset they need to learn how to make sense of it. A data visualization consultant, such as N-iX, can help them explore and visualize the data in various ways, potentially revealing previously hidden insights. These insights can lead to new opportunities for the company, such as identifying new markets to target or improving its operations.
Improved view of operations. One of the key benefits of using data visualization in business is communicating complex or technical information in a more easily understandable way. A data visualization consultant at N-iX can help a company achieve this by creating visualizations that convey findings and insights to stakeholders. For example, N-iX experts can use visualization tools to help stakeholders understand data trends or create interactive maps or dashboards to make it easier for employees to explore and analyze data independently.
3 Steps of choosing a data visualization consultant
When choosing a data visualization consulting company, there are three core things to keep in mind:
1. Look for a vendor with strong data expertise: Data visualization firms should have extensive knowledge and experience in analytics, visualization, and BI. Ask them questions regarding the technologies they use, the types of projects they have worked on in the past, and their approach to analyzing, interpreting, and visualizing data. Also, inquire about the kinds of data they work with (structured and unstructured) to ensure that their skills and expertise match the data you are working with.
2. Evaluate their previous projects. Ask for samples, case studies, customer reviews, or endorsements to understand the quality of their data visualization services. Before starting a negotiation with an enterprise data visualization consultant, look for their understanding of the data visualization process, from collecting, capturing, and collating the data to transforming it into visuals that one can easily understand. Additionally, you should assess their ability to use tools such as Tableau, Power BI, and D3.js to create easily readable visualizations and deliver actionable insights.
3. Examine the pricing models: Before looking at various data visualization companies, consider the pricing models seriously. Review the available payment options and cooperation models. It will ensure you get the expected results, all while staying within the budget. During this step, consider the type of service you’d be using and the longevity of the consulting stage. Moreover, once you have a sense of budget, take your time to compare the available data visualization consulting firms to choose the vendor with the right expertise on board.
Read more: 25 trusted Big Data analytics services companies across the globe
Data visualization in action: Success stories of Gogo and cleverbridge
Let’s take a closer look at how data visualization and robust expertise in this field have helped two leading enterprises to achieve their business goals.
Gogo
It is a global provider of in-flight broadband Internet with 20+ years of experience and 2,000+ employees. Gogo now has partnerships with 16 commercial airlines and has installed its flight connectivity solutions to more than 2,900 commercial aircraft. The business challenge was to ensure the high speed of the in-flight Internet and predict equipment failures.
For that reason, the N-iX Data Unit has assisted the client with migrating to the AWS Cloud and built a Cloud-based unified data platform. Regarding the data visualization part, we provided the C-level decision-makers with comprehensive visualized reports on financial data and operational health. These indicators included data consumption, purchases, data usage, modem performance, a Wireless Access Point, Service Level Agreements, and more. On top of that, the N-iX team has developed a reporting tool that identifies the user’s pain points when connected to the Internet.
The cooperation between N-iX and Gogo has allowed for delivering a comprehensive solution, including:
- Migration to the Cloud, allowing the client to reduce licensing and on-premise storage costs;
- Comprehensive visualized reports of financial data and operational health;
- Predictive analytics, which allowed to predict the antenna failures;
- The team identified the reasons behind the ill-performance of antennas, preventing some typical failure cases.
As a whole, the partnership of N-iX and Gogo has helped the client in many ways, while the visualized reports have played a part in achieving the company’s business objectives.
Read more: Big Data analytics for improved maintenance and flawless operation of the in-flight internet
cleverbridge
Germany-based cleverbridge provides e-commerce and subscription management solutions for monetizing digital goods, online services, and SaaS solutions. The company capitalizes on its cloud-based e-commerce platform that makes recurring billing easier, optimizes customer experience, and offers innovative global compliance and payment capabilities. The business challenge of cleverbridge was to provide precise and visually informative data analytics reports.
N-iX experts started Product Discovery to design an effective data strategy. The team designed a full-fledged data strategy with a clear implementation plan for the reporting solution based on Power BI. We used the AWS DMS to retrieve on-premise data, transferred it to AWS S3, and implemented the data movement through Apache Spark. As a result, the data was also moved to Snowflake, making it possible to build informative Power BI reports with analytics based on the most crucial Subscription metrics.
As the result of N-iX and cleveridge’s cooperation, the client has gained several benefits, such as:
- Increasing the value proposition with a universal reporting solution;
- Boosting information security by establishing an effective data governance strategy;
- Enhancing business decision-making capabilities by allowing internal solution use.
Read more: Driving growth in e-commerce with a comprehensive data analytics solution
Summary
Data visualization consulting presents an excellent opportunity to maximize the value of data and gain actionable insights. With an array of services available on the market, it’s vital to know how to select the right provider and benefit from visualization the most.
With the help of experienced professionals at N-iX, businesses can leverage their data better to understand customer behaviors, trends, and market behavior. Data visualization consulting can be critical to any successful data-driven strategy, leading to increased efficiency, improved decision-making, and growth opportunities.
Why choose N-iX as your data consulting visualization partner?
- N-iX is a reputable Big Data vendor with 10+ years of proven expertise in data-related services;
- N-iX has a robust team of 200+ data specialists with expertise in data visualization, Business Intelligence, AI/ML, Data Analytics, and Data Analytics strategy, among the few;
- The company’s experts have a deep knowledge of data visualization tools, such as PowerBI, Looker, Tableau, and programming-language-based frameworks, including D3.js, Recharts, and Chart.js;
- Among N-iX clients in Data services are cleverbridge, Discovery, Lebara, AVL, Orbus Software, Gogo, and Fortune 500 companies;
- N-iX has been repeatedly recognized by CRN among the leading solutions providers in North America, as proven by Solution Provider 500 and CRN Fast Growth 150 ratings;
- The company complies with industry regulations and standards, including PCI DSS, ISO 9001, ISO 27001, and GDPR.
Have a question?
Speak to an expert