
When two dashboards show different numbers for the same KPI, the executive meeting stalls while teams debate whose report is right. Across more than 60 data projects, N-iX has seen the same pattern: BI grows faster than the analytical structure behind it, and metrics drift apart while every dashboard keeps running.
The root cause sits upstream. A CRM marks a customer “active” at sign-up, and billing waits for the first paid invoice. “X Inc.”, “X INC”, and “X Incorporated” become three accounts with three revenue figures. A price change from $10 to $15 overwrites history and makes last quarter look like growth. Heavy analytical queries compete with live transactional systems for CPU and memory. Any AI model trained on that data learns the same inconsistencies.
In this guide, Rostyslav Fedynyshyn, Head of Data and Analytics Practice at N-iX, sets out five ways a governed data warehouse keeps BI consistent. He compares ETL and ELT, maps responsibilities across ingestion, modeling, and BI consumption, and shows how this discipline supports six everyday BI practices. He also covers what AI analytics needs, from point-in-time feature accuracy to lineage for compliance. The guide includes an N-iX case study: a global managed Cloud services provider consolidated more than 70 data sources, decommissioned over 20 servers, and saved over $1M.
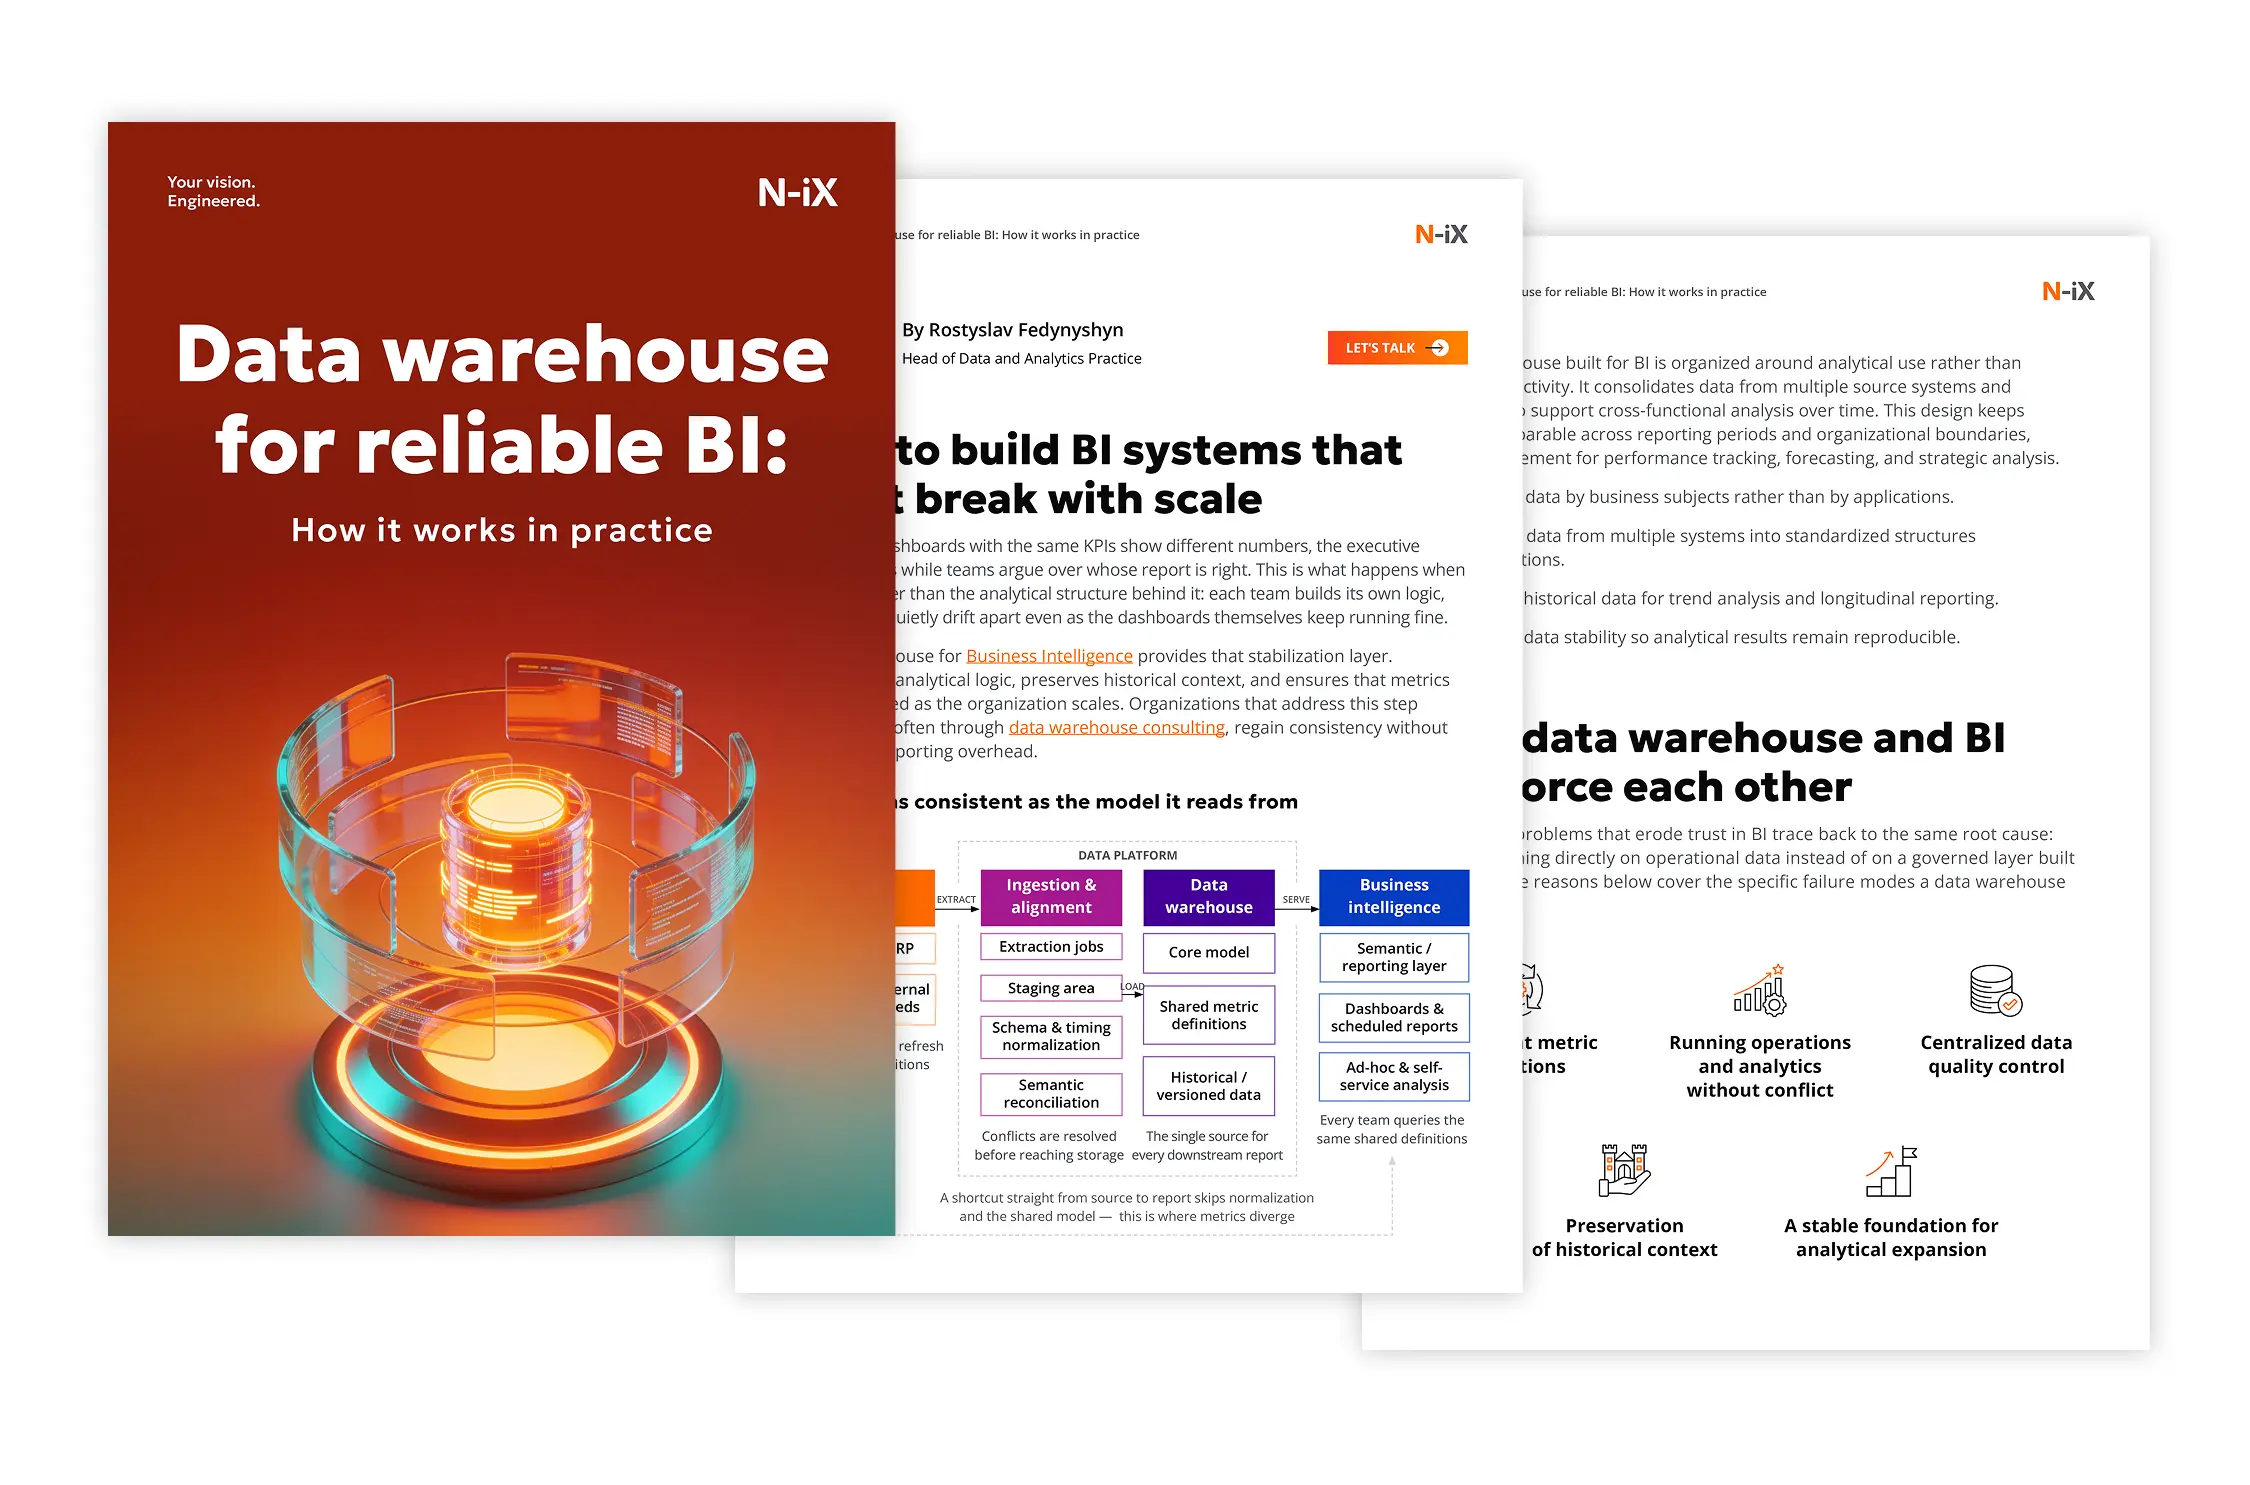
Discover how a governed analytics layer aligns metrics, preserves history, and prepares your data for AI in this guide!
Is your BI team reconciling numbers more than analyzing them? See how a data warehouse fixes it!
From shared metric definitions to point-in-time history, see how a governed analytics layer keeps BI reporting consistent at scale.