
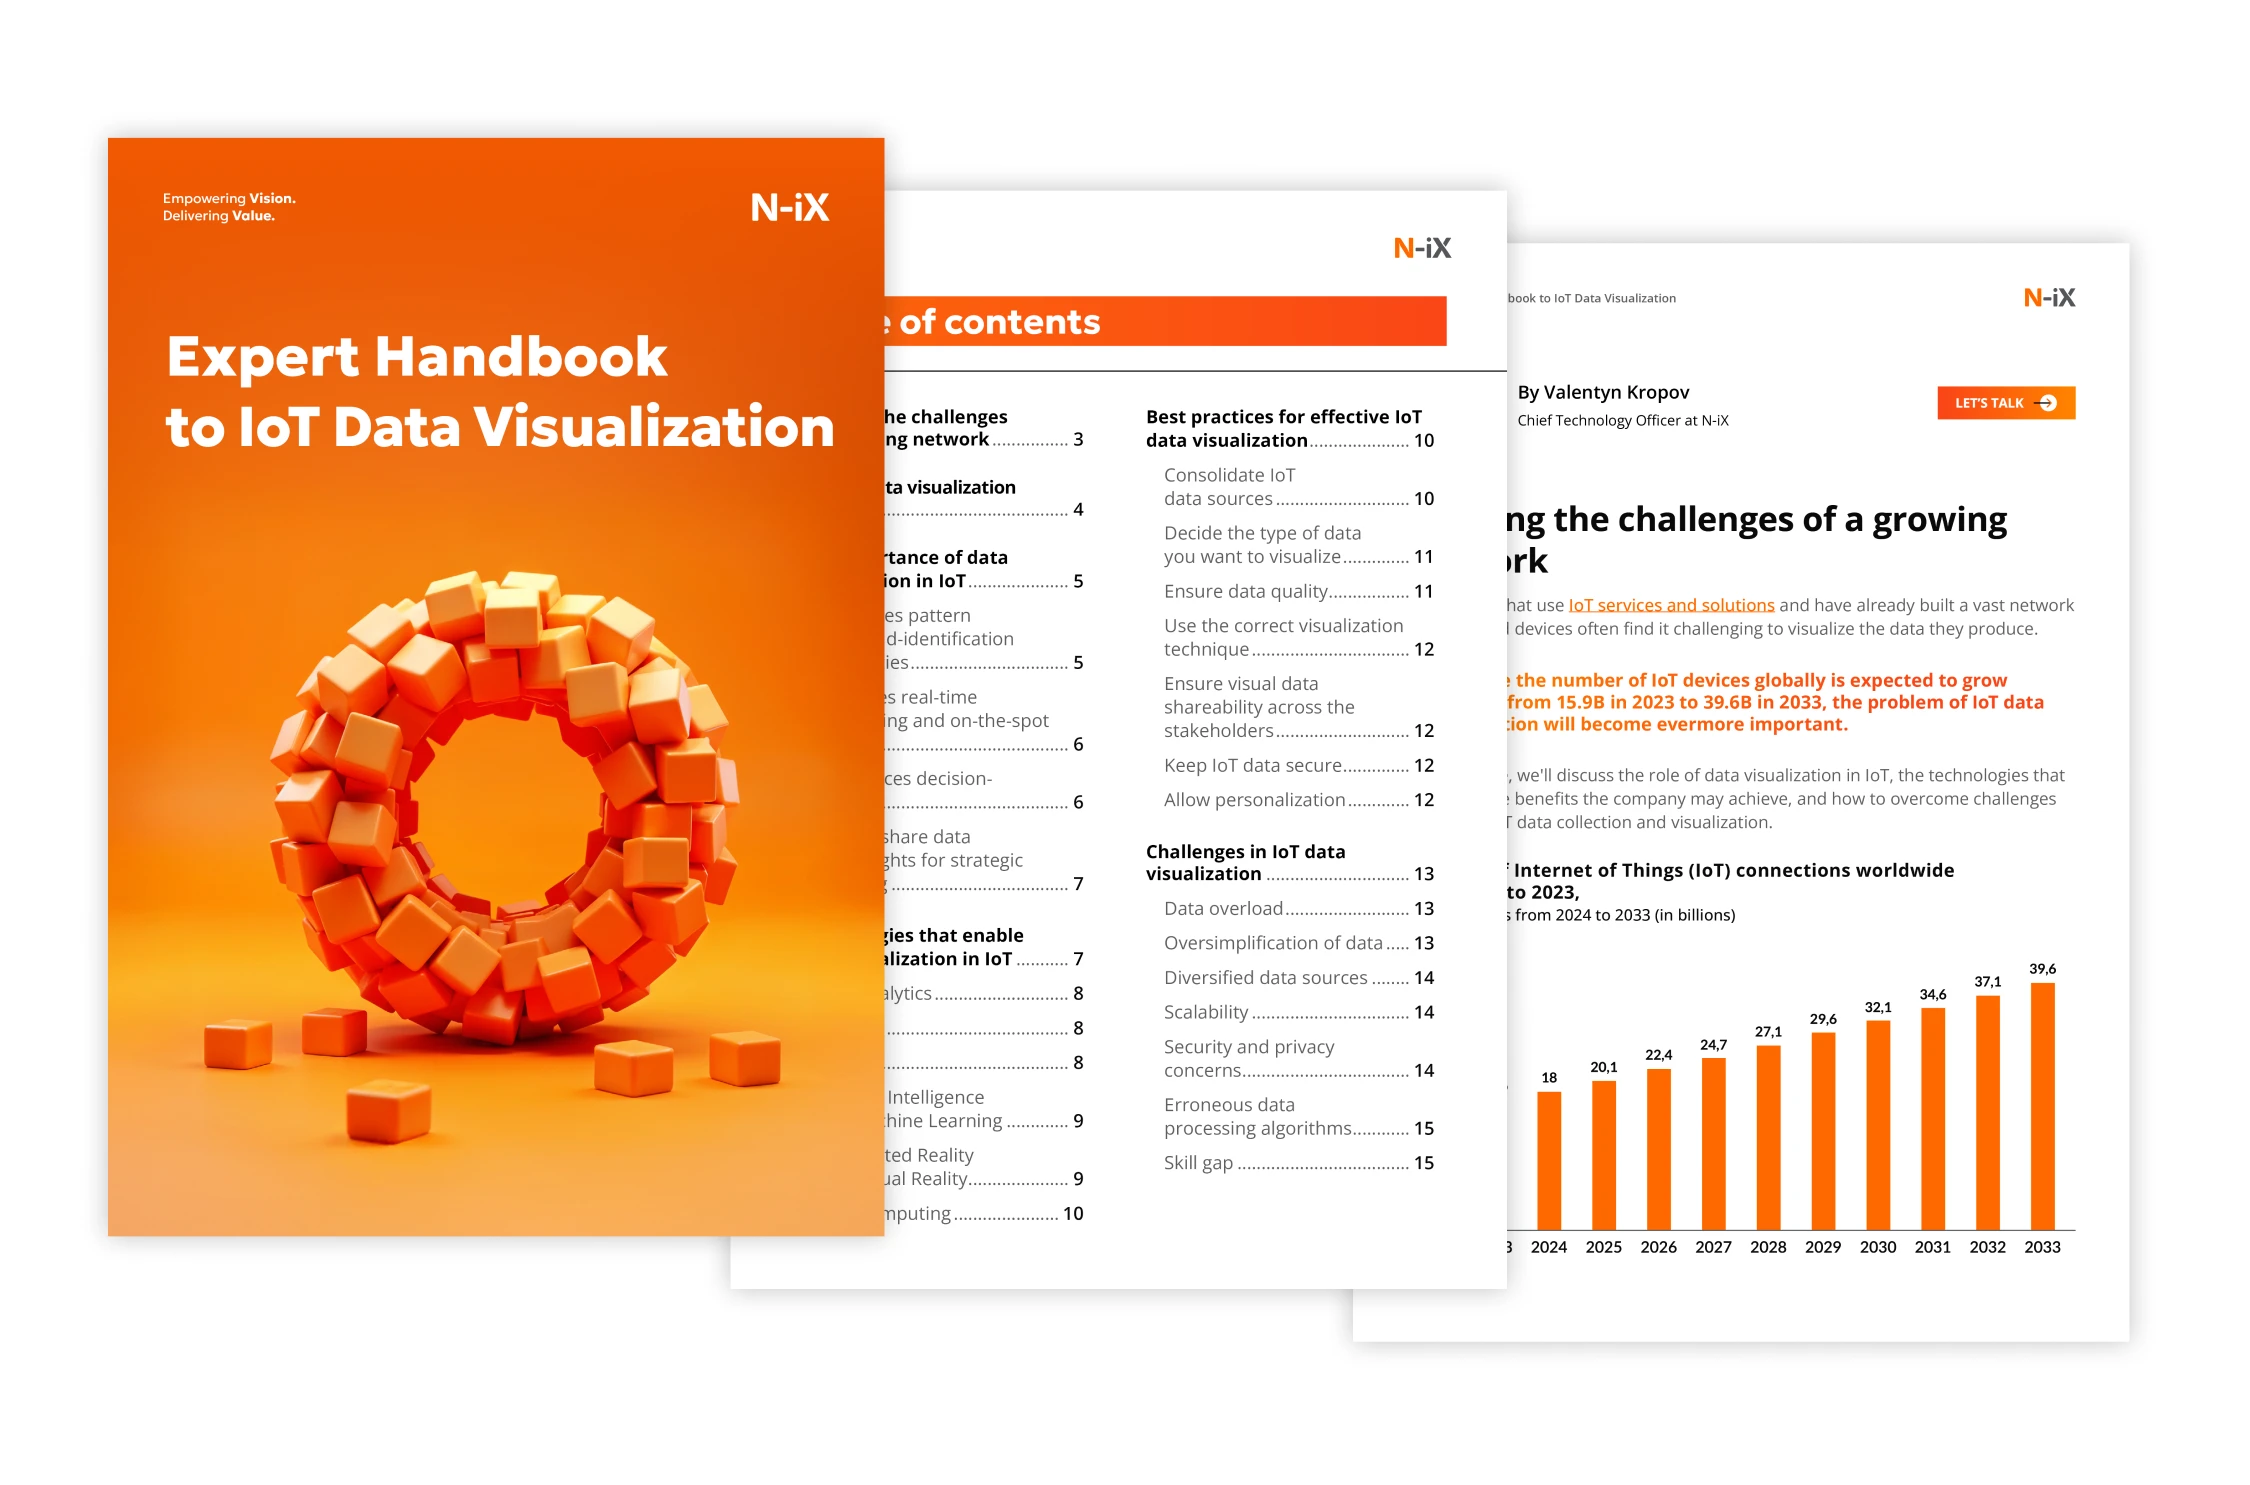
The global number of IoT devices is projected to reach 39.6B by 2033. As IoT networks expand and generate vast amounts of data, businesses face the challenge of transforming this data into actionable insights. Effective IoT data visualization simplifies complex datasets, enabling businesses to improve performance, drive innovation, and make informed decisions.
This сomprehensive guide explores the role of data visualization in IoT, from identifying trends to enabling real-time monitoring and strategic planning. It delves into the technologies that power IoT data visualization, including data analytics, Big Data, cloud solutions, AI and ML. The white paper also covers best practices for ensuring data quality, selecting the right visualization techniques, and addressing challenges like data overload and security risks.
Download our guide to discover how to implement effective IoT data visualization and leverage data-driven insights to stay ahead of the competition!