
Key takeaways
- Data visualization companies build the data models, reports and dashboards that give a team one clear view of its numbers.
- Firms range from global consultancies such as Deloitte and Accenture to specialist BI firms and engineering-led partners such as N-iX.
- Metric definitions and data quality come before chart design, because a dashboard shows only what the data layer gives it.
- Experience on your own BI tool and warehouse matters more than a long tool list.
- AI inside a dashboard needs figures that trace back to their source and model version.
Choosing the wrong data visualization partner leaves you with dashboards that teams stop opening. A live monitoring screen stalls at the first slow refresh, and a board report built from several systems shows conflicting figures. Both failures start in the data analytics layer behind the screen, and each needs a different fix.
A reliable data visualization company plans for your situation. It connects your sources, agrees with the business what each metric means, keeps reports fast on your data volumes, applies your access rules, and supports the dashboards after launch.
The list below covers 15 top data visualization companies for 2026, from global consultancies to specialist BI firms, with the core services each one offers. Each firm was assessed on public evidence of dashboard and BI work, tool expertise, and industry experience.
How we selected data visualization consulting companies
A dashboard is only as reliable as the data structure behind it. Scattered sources, unclear metric definitions, and a model built without speed in mind produce charts that look right and answer wrongly. For that reason, the assessment covered each firm's data services as a whole, from engineering and integration to governance and AI, with chart design as one part of the picture.
Every company here was judged on what a buyer can check for themselves: service pages, dashboard portfolios, case studies, certificate pages, partner directories, analyst reports, and ratings on Clutch (the independent B2B review platform), G2, and Gartner Peer Insights. The list covers top data visualization companies. Visualization software, such as Tableau, Microsoft Power BI, Qlik,k and Looker, is out of scope.
Five criteria shaped the assessment, and the table shows how much weight each carried. They run from the strongest evidence of past work to the weakest.
1. Outcomes in case studies
A case study that shows a finished dashboard and states a result carries the most weight: faster reporting, fewer manual spreadsheets, one metric the whole business now uses. Anonymized cases count when the result is specific.
2. Data foundation
A visualization project succeeds or fails in the data layer. We looked for documented work on integrating many sources, warehouses and lakes, a business glossary with agreed metric definitions, data quality checks, governance and speed on large data sets. Firms that deliver these steps as part of the dashboard project were examined more closely.
3. Tool and design expertise
Named skills in the platforms buyers ask about, such as Tableau, Power BI, Qlik and Looker, and custom work with code libraries such as D3.js and React, show tool depth. The best dashboards answer a question at a glance, so a visible design practice, interactive reports and a clear approach to data storytelling counted for more than a list of chart types.
4. AI integration
Dashboards increasingly carry forecasts, anomaly alerts, and questions asked in plain language. We checked for machine learning models connected to reporting, AI assistants and natural-language search inside BI tools, and for the data preparation that keeps them reliable. A published example of AI inside a live dashboard counted for more than a general AI service page.
5. Delivery, security and recognition
Team size, delivery footprint, training and post-launch support show whether a firm can run a real program. Dashboards often show sensitive records, so certificates such as ISO 27001 and SOC 2, and experience with rules such as GDPR and HIPAA count. Ratings and reviews on Clutch, G2 and Gartner Peer Insights are included where a profile exists, along with analyst recognition from Gartner, Everest Group and ISG. Numbers move often. Confirm them before you shortlist. Large consultancies rarely appear on review sites, so analyst recognition is the main source.
|
Criterion |
Weight |
What we checked |
|
Outcomes in case studies |
25% |
A finished dashboard with a stated result |
|
Data foundation |
25% |
Integration, warehouses, metric definitions, data quality, governance and speed on large data sets |
|
Tool and design expertise |
20% |
Tableau, Power BI, Qlik, Looker, custom code, design practice and interactive reports |
|
AI integration |
15% |
Machine learning models, AI assistants, natural-language search and anomaly alerts connected to dashboards |
|
Delivery, security and recognition |
15% |
Team size, support, certificates, sector rules, ratings and analyst recognition |
N-iX published this list and is one of the companies on it. Every firm, N-iX included, was judged on the same criteria and the same kinds of public data. No company paid to be here. We set the criteria before looking at any company and applied them the same way to each.
The 15 top data visualization services companies below appear in no particular order. The numbers only label the profiles, and a lower number means no better fit than a higher one. The companies differ in specialization, industry focus, and engagement model.
Data visualization companies compared: platforms, expertise and industry fit
|
Company |
Platform focus |
Data visualization expertise |
Data-related services |
Industry fit |
|
Deloitte |
Tableau, Power BI |
Live interactive dashboards, dashboard performance tuning, Tableau and Power BI server administration |
BI and data warehouse design patterns, metadata and data dictionary standards |
Retail, financial services, public sector |
|
Accenture |
Tableau (alliance partner), Power BI, Qlik, Looker |
Dashboard and analytics consulting, data visualization consultants |
Data engineering, data science, data governance |
Communications and media, financial services, health and public service, consumer goods and retail, energy and utilities |
|
N-iX |
Power BI, Tableau, Qlik, AWS QuickSight, Looker, Databricks SQL |
Embedded Power BI dashboards, custom D3.js visualizations, a portfolio of over 100 dashboards for one client |
Data warehouse and ETL on AWS, Azure, Snowflake and Databricks, plus a semantic layer for dashboards. Data engineering, data science, data governance |
Retail, finance, industrial supply, ecommerce, manufacturing, automotive, logistics |
|
InterWorks |
Tableau, ThoughtSpot, Snowflake |
Dashboard design, strategy and roadmap, performance tuning, embedded analytics, training |
Data architecture, integration and preparation, warehousing, governance |
Finance, healthcare, energy, retail, manufacturing, government, media |
|
Affirma Consulting |
Power BI, Microsoft BI stack |
Power BI dashboards, BI consulting |
Governance framework, Purview, Microsoft data solutions |
Finance, manufacturing, consumer products, hospitality |
|
Algoscale |
Tableau (services and technology partner), Power BI, Looker |
Over 650 Tableau dashboards, Power BI implementation, custom visualization tools, Tableau to Power BI migration |
Data engineering on AWS, Azure, Microsoft Fabric and Snowflake, ETL pipelines |
Healthcare, banking and insurance, retail, ecommerce, SaaS, manufacturing, education, real estate |
|
Dynamic Data |
Tableau, Power BI, Metabase, Sigma |
Interactive dashboards with real-time or daily refresh, marketing performance reporting |
Snowflake, dbt and Fivetran data stack, data integration and modeling, predictive analytics |
Healthcare, facility services, advertising and marketing, media |
|
Successive Digital |
Power BI, Tableau, plus ETL tools |
Custom data models, visual representations, advanced analytics |
Custom data models, analytics solutions |
Retail, logistics |
|
Litslink |
Power BI, Tableau, Logi Analytics, Microsoft Fabric |
Interactive visualizations with an AI and ML focus |
AI and machine learning development |
Fintech, ecommerce, automotive, healthcare |
|
Edvantis |
Tableau, Amazon QuickSight |
Big Data analytics, predictive modeling, BI |
Big Data and data engineering, predictive analytics |
Banking and finance, healthcare, retail, hi-tech |
|
Intellectsoft |
Power BI, Tableau, Amazon QuickSight |
Power BI development, governance and security, training, managed services |
Data integration, warehousing, predictive analytics |
Regulated and data-intensive sectors, with HIPAA, GDPR and ISO support |
|
Lingaro |
Power BI, Tableau, Qlik |
Over 500 BI solutions delivered, by its own count |
Data strategy, data management, transformation, data science and AI, with Azure partnership |
Consumer goods, manufacturing, retail, luxury, life sciences |
|
Opinov8 |
Power BI, Tableau, D3.js, Python and Plotly |
Data strategy, ecosystem guidance, platform design |
Data strategy, platform design |
Healthcare, finance, retail |
|
Softweb Solutions |
Tableau, Power BI, Logi Analytics |
Over 350 dashboards in Power BI and Tableau, 60+ visualization experts |
Big Data, data engineering, warehousing, data science, IoT |
Retail, healthcare, automotive, financial services |
Top 15 data visualization companies worldwide
1. Deloitte
A global professional services firm pairs strategy work with visual analytics through its Tableau alliance, which grew out of a strategic agreement signed in 2012. Its teams build live, interactive dashboards in Tableau and Power BI and tune them for speed on large data sets. The same teams design the layer underneath, from BI and data warehouse patterns to metadata and data dictionary standards.
2. Accenture
This is a global professional services firm and a Tableau alliance partner, with data visualization consultants who work in Power BI, Tableau, Qlik, and Looker. Its teams build management dashboards and scorecards and integrate data from several sources before deployment. They also add dashboards to warehouses such as Snowflake, Google Cloud, and Databricks. Its clients come from five industry groups: financial services, health and public service, and consumer goods and retail.
3. N-iX
N-iX is a data visualization partner that builds the data model, pipelines, and dashboards as one connected system. The company works in Power BI, Tableau, Qlik, AWS QuickSight, Looker, and Databricks SQL, and it builds custom visualizations with D3.js. ISG named N-iX a "Rising Star in Data Engineering".
Verified outcomes:
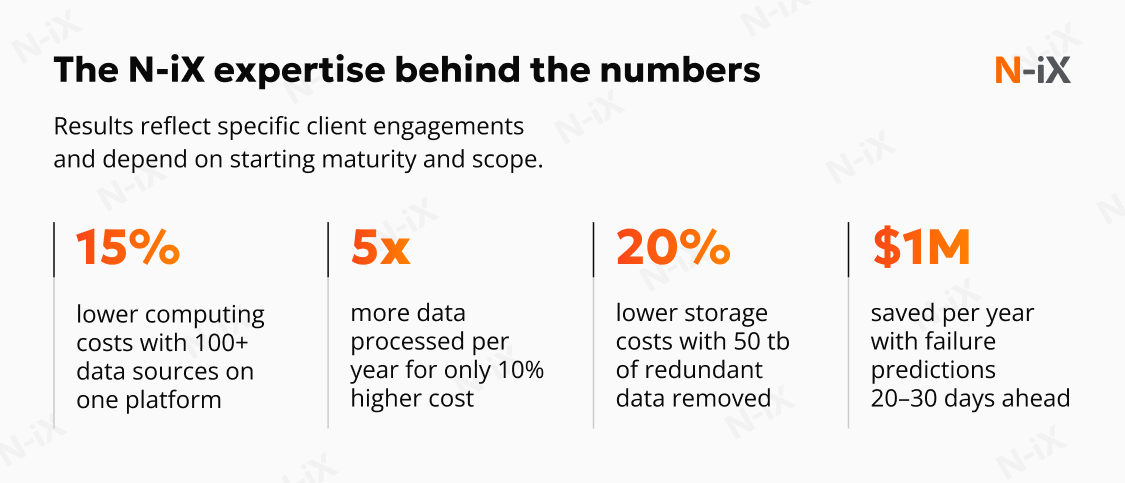
- Cut report delivery time by 57% across Power BI engagements, reducing report customization from three weeks to two hours.
- Built 100+ dashboards in Power BI, Tableau, and Qlik for Orbus Software's strategic portfolio management product, an enterprise architecture software provider.
- Removed BI report delays for Lebara, a mobile virtual network operator, with an Azure-based data lake that supports near-real-time streaming and timely reports for several departments.
- Power BI reports for an ecommerce and subscription management provider on a unified AWS data platform, helping the client strengthen its offering to its customers.
- More than 100 data sources unified on a Snowflake and Airflow platform on AWS, with Tableau reporting, for a Fortune 500 industrial supply company.
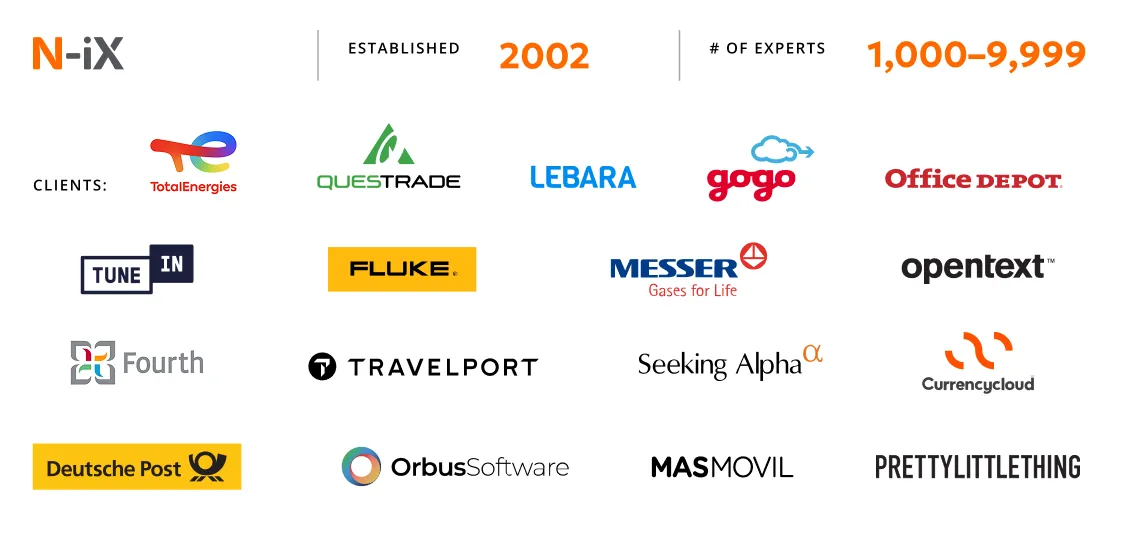
N-iX has worked in technology consulting and custom software development for over 24 years, with delivery centers across 25 countries in Europe, the Americas, and APAC. The team of more than 2,400 tech experts includes over 200 data specialists, and it serves over 160 clients, including Fortune 500 enterprises. The average client relationship lasts over seven years. More than 400 cloud experts hold official partnerships with AWS, Google Cloud and Microsoft Azure.
Data visualization is one of its core specializations. Services include:
- ETL, data warehouse and OLAP design: the data model behind every dashboard
- Custom reports that show trends, patterns and outliers
- Interactive dashboards for KPIs in Power BI, Tableau, Qlik, AWS QuickSight, Looker and Databricks SQL
- Real-time and near real-time analytics with automated reporting
- Custom visualizations for web applications in D3.js and Python
- BI tool migration and refactoring
- Machine Learning models and anomaly detection connected to dashboards
N-iX data engineers and BI developers build on these tools:
- BI and dashboards: Power BI (the most used), Tableau, Qlik, AWS QuickSight, Looker, Databricks SQL
- Custom visualization: D3.js, Python (Matplotlib, Seaborn, Dash, Jupyter)
- Reporting and semantic layer: SQL Server Reporting Services, Cube Dev
- Data platforms: Snowflake, Databricks, Amazon Redshift, Azure Synapse Analytics, Azure Data Factory, AWS Glue

4. InterWorks
The consultancy, founded in 1996, has worked with Tableau since 200. Its services range from dashboard and visualization design to data preparation, performance tuning, governance planning and Tableau Cloud migrations. The team has widened its stack to Sigma, ThoughtSpot and Snowflake, and it offers embedded analytics, training and ongoing support. Clients come from finance, healthcare, energy, retail, manufacturing, government and media.
5. Affirma
This vendor has built its work around Microsoft technology since 2001. Its BI services center on Power BI and the wider Microsoft data stack, from dashboards for real-time reporting to BI consulting and tool migrations. Data governance sits alongside this, with a framework, shared data definitions, and Purview tooling that give dashboards agreed metrics. Their clients include finance, manufacturing, consumer products and hospitality companies.
6. Algoscale
The boutique consultancy, founded in 2014, holds Tableau status as both a services and a technology partner. It builds dashboards in Tableau, Power BI and Looker, and its services include Power BI implementation, mobile BI, custom visualization tools and Tableau to Power BI migrations. Data engineering on AWS, Azure, Microsoft Fabric and Snowflake sits behind them. Healthcare, banking and insurance, retail, ecommerce, SaaS and manufacturing industries are among their major clients.
7. Dynamic Data
This consultancy provider builds both the data stack and the dashboards that sit on top of it. Its team works in Tableau, Power BI, Metabase, and Sigma, on a Snowflake, db,t and Fivetran stack. Typical projects combine data from sales, marketing, ng and product systems and deliver dashboards that refresh in real time or daily. They work with healthcare analytics, facility services, and advertising and marketing companies.
8. Successive Digital
The vendor operates globally, employing experts across several regions, including North America, Europe, and Asia. They primarily serve the retail and logistics industries. The company's expertise encompasses developing custom data models, intuitive visual representations, and advanced analytics solutions that facilitate comprehensive insights into performance metrics.
9. Litslink
Founded in 2014, one of the leading data visualization companies is based in the US and Ukraine. Their expertise includes creating intuitive, interactive data visualizations, with a focus on AI and Machine Learning technologies. This consultant uses Power BI, Tableau, Logi Analytics, and Microsoft Fabric to deliver visualizations to industries such as fintech, ecommerce, automotive, healthcare, etc.
10. Edvantis
Founded in 2005, this enterprise operates across Germany, the US, Poland, Ukraine, and several other remote hubs, employing a robust team of Data Science and engineering specialists. The company primarily serves the healthcare, real estate, and transportation sectors, providing customized solutions that improve operational efficiency. Its data visualization expertise spans Big Data analytics, predictive modeling, and Business Intelligence.
11. Intellectsoft
One of the well-known data visualization companies, this vendor is headquartered in the US and has regional offices in Europe and Asia. The company serves diverse industries, including healthcare, fintech, and manufacturing. They create custom data visualization software and tools, complemented by expertise in Big Data analytics, IoT, and predictive AI development.
12. Slalom
The Seattle consultancy brings Tableau, Qlik, and Power BI content into one place. Its services cover data discovery, self-service reporting, customer-facing embedded dashboards and a center of excellence for visualization and data culture, with Tableau Server deployments on AWS and Azure. The same teams build the platforms underneath, on Snowflake and Databricks, and add a governance operating model. Industry focus includes financial services, healthcare, life sciences, and retail.

13. Lingaro Group
Established over a decade ago, this data visualization enterprise operates globally. Renowned for its comprehensive data visualization services, it specializes in creating dynamic, AI-powered visual analytics and customized dashboards using advanced tools like Power BI, Tableau, and Qlik.
14. Opinov8
With a presence in the UK and Ukraine, the vendor boasts a team of over 300 experts. This data visualization company serves industries that demand rigorous data solutions, including healthcare, finance, and retail. The vendor offers comprehensive services, including data strategy, ecosystem guidance, and platform design.
15. Softweb Solutions
Established in 2006, the enterprise operates globally with a team of over 500 experts. Their data visualization services encompass custom dashboard creation, BI platform development, optimization, training, real-time data monitoring, and strategy consulting, tailored to industries including inventory management, healthcare, finance, banking, surveys, and HR.
How to evaluate a data visualization partner: 6 steps
Six checks separate trusted data visualization companies from vendors that deliver charts that look good in a demo. They follow the criteria behind this list. Use the same six checks to compare top data visualization companies side by side.
1. Data foundation
A dashboard shows only what the data layer gives it. The first workshop should cover sources, joins, and metric definitions, and screens come later. Request a sample business glossary or semantic layer, and the refresh and query times of the largest dashboard. A data visualization company that sketches screens before it maps the sources is a warning sign.
Questions to ask best data visualization consulting companies:
- Who owns each metric definition on the client side?
- What happens to a dashboard when a source system changes a column?
- How are failed data quality checks reported, and who fixes them?
2. Production results
Look for case studies that state a result, such as faster reporting, fewer manual spreadsheets, or one metric the whole business now uses. Request references for dashboards that have run for at least six months, and ask each client for weekly usage figures. Check how the partner trains users, because adoption decides whether the work lasts. Ratings on Clutch, G2, and Gartner Peer Insights add one signal, and analyst recognition from Gartner, Everest Group, or ISG adds another.
Questions to ask best data visualization companies:
- How did each client measure the result?
- What changed after the first release, based on user feedback?
3. Platform fit
Name your stack first: the data visualization tools and technologies you run, such as Tableau, Power BI, Qlik, or Looker on a warehouse like Snowflake, Databricks, or Azure Synapse. Request a project with the same combination, and a clear reason for choosing a packaged tool or a custom build (for example, with D3.js). A semantic layer defined outside a single BI tool keeps a later move between tools affordable.
Questions to ask best data visualization development companies:
- What would a move between BI tools cost in rework?
- Which parts of the build depend on a single vendor?
- How do embedded dashboards sign users in?
- Which API connections are standard, and which need custom work?
4. Design and team
A dashboard that answers a question at a glance takes design. Strong teams show wireframes or a prototype early, test them with real users, and introduce the project lead, BI developers,s and data engineers before signing. A portfolio of finished, interactive examples says more than a list of chart types.
Questions to ask data visualization consulting companies:
- How do you handle change requests after the first release?
- What happens if a key team member leaves mid-project?
5. AI integration
Dashboards now carry forecasts, anomaly alerts, and questions asked in plain language. Request one live example of a model or an AI assistant inside a working dashboard. Each AI figure should trace back to its source and model version, so a reader can see why a number changed.
Questions to ask:
- How does the dashboard behave when an AI answer is wrong or missing?
- Who reviews AI features before release?
- Which models can you swap without rebuilding the dashboard?
- How is the cost of AI queries tracked?
6. Security, ownership and support
Dashboards often show sensitive records. Ask about row-level access and audit trails, request current ISO 27001 or SOC 2 certificates, and check experience with rules such as GDPR and HIPAA. Request a cost breakdown that separates the build from running costs, and agree what the data visualization services include after launch. Start with a prototype on one use case and one success metric.
Questions to ask best data visualization companies:
- How do you test access rules before launch?
- What happens to our data and models when the contract ends?
- Which running costs will grow with more users or more data?
Why should you partner with N-iX as your trusted data visualization provider?
N-iX meets the six checks above with evidence:
- Data foundation first. We design the ETL, warehouse, and OLAP layer behind every dashboard, and we build a semantic layer where each key metric is defined once and reused across reports.
- Platform fit. Power BI is our most used tool, alongside Tableau, Qlik, AWS QuickSight, Looker, and Databricks SQL, with custom D3.js work for web applications. Over 400 cloud experts hold official partnerships with AWS, Google Cloud, and Microsoft Azure.
- A team that covers the whole path. More than 2,400 tech experts, including over 200 data specialists, take a project from data engineering to dashboards and machine learning.
- Proven staying power. N-iX has worked in technology consulting and custom software development for over 24 years, and the average client relationship lasts more than seven years.
- Security and compliance. Our delivery complies with ISO 27001, ISO 9001, PCI DSS, and GDPR standards.
- Support after launch. We cover consulting, development, ongoing support, and maintenance, so the dashboard keeps pace with its sources, and we hand over training, documentation, and code.
- Industry recognition. N-iX appears in the CRN Solution Provider 500, in Global Outsourcing 100 by IAOP and in ISG Provider Lens, where ISG named it a Rising Star in Data Engineering.
FAQ
What do data visualization companies provide?
Data visualization companies design the data model behind a dashboard, build reports and dashboards in tools such as Tableau, Power BI, Qlik, and Looker, and support them after launch. They sell services, and the software itself comes from the BI vendors. At N-iX, one team delivers the data engineering, the semantic layer, and the dashboards.
What are the benefits of hiring a data visualization consultant?
A consultant brings a tested data model, tool experience, and a design practice, shortening the path from raw data to a dashboard teams use. The work can start without a long search for scarce BI developers, and an in-house team can take over later. N-iX covers consulting, development, ongoing support, and maintenance.
Should I choose a custom data visualization agency or off-the-shelf BI software?
Off-the-shelf BI software such as Tableau or Power BI covers most reporting needs, and a custom build with D3.js or embedded analytics suits unusual charts or dashboards inside a product. Many projects combine both: a BI tool for internal reports and custom work for the customer-facing screen. We work in both, from Power BI dashboards to custom D3.js visualizations.
Which data visualization companies work on healthcare analytics?
Look for the best data visualization companies with sector case studies, experience with HIPAA and EHR integration, and a clear approach to access control for patient data. Healthcare dashboards depend on clean, well-defined clinical data, so ask how the partner handles data quality. N-iX is one of the healthcare data visualization companies that built a data analytics platform for a clinical trial software provider, which cut anomaly detection from several days to minutes.
What should CTOs and data architects look for in enterprise data visualization solutions?
They should look for a semantic layer defined outside a single BI tool, row-level security, standard APIs to CRM and ERP systems, and a clear view of running costs as users grow. A reference project at similar data volumes shows whether the design holds under load. N-iX teams build the data layer, the semantic layer and the dashboards together, on AWS, Azure, Snowflake and Databricks.
Can data visualization companies handle real-time and big data?
Yes, when the pipeline ingests events as they arrive, the store answers queries quickly, and the refresh design protects the source systems. Ask professional data visualization service agencies for a project that states the data volume and the refresh time. At N-iX, we built a platform that processes up to 3 TB of streaming data per day from 20 sources.


